In any plant, we find lots of piping with different sizes to transport different fluids between equipment. We see how a piping engineer considers complex connections between lines based on the requirements of a process engineer. Here comes the important role of pipe sizing activity, which is a major activity within process design.
Role of Pipe Sizing in Plant Operation and Safety
Proper pipe sizing is crucial for optimizing the fluid flow characteristics to meet the operational demands of the plant while minimizing costs. Oversizing pipes can lead to unnecessary capital expenditure and increased space requirements for piping systems. Conversely, undersized pipes can cause high velocity and pressure drops, leading to operational inefficiencies and potential damage to the pipes and related equipment.
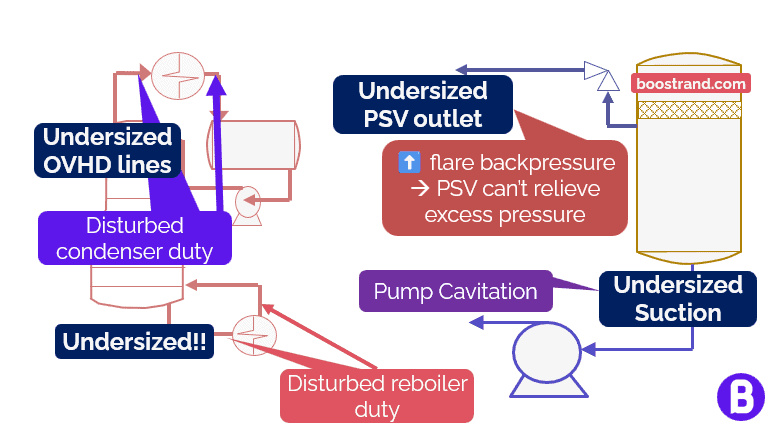
For example, imagine a pump with an undersized suction line, this can cause pump cavitation and may eventually lead to pump damage.
When dealing with a tower condenser or reboiler, things can become even more complicated. If piping isn’t properly sized, this shall cause different reboiler and condenser duties, leading to disturbance in the whole tower operation, which can eventually lead to an unplanned shutdown or off-spec product. This can cause a huge loss of money.
If the PSV inlet or outlet piping isn’t well sized, this can lead to disturbance in the operation of a PSV, which can mean that the PSV may not protect the system well, leading to a great safety issue.
So here we are talking about a critical activity that significantly influences the cost, efficiency, and safety of the entire plant.
Main Line Sizing Criteria
So how would we choose the proper pipe size? This depends on various factors and criteria. Let’s go through them.
Maximum Accepted Velocity
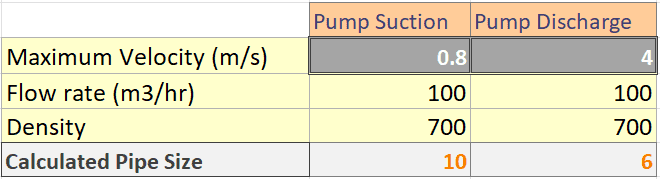
When choosing the applicable line size, velocity is commonly the first criterion used to get a preliminary size.
The acceptable velocity limits depend on the service of the fluid. For example, we can accept much higher velocities in gas lines than in liquid lines. Higher velocities are acceptable in pump discharge lines than in pump suction lines. We can even approach the velocity of sound in flare header lines.
For a liquid, high velocities can cause line erosion, and sometimes a cause of corrosion in the pipe. This is why standards like API 14E limit the maximum liquid velocity to 15 ft/s to avoid pipe erosion. However, we should take in mind that API 14E is made for offshore pipelines, where there are restrictions with respect to area and weight.
In most cases, we don’t have these restrictions. So it would be better to reduce the maximum velocity for sizing, which can lead to a larger pipe size. That’s why most company standards consider more stringent velocity criteria of around 10 ft/s.
In cases of rich Amine fluids, API 945 even reduced the maximum velocity in the pipe to only 6 ft/s to avoid corrosion of carbon steel pipes at higher velocities.
For a gas, high velocities can cause high noise, this noise can be too high to the point that it can affect the human ear if it is continuous, or it can lead to choked flow if it approaches the velocity of sound. That’s why it’s common here to consider the momentum criteria, which is the ρv2. In API 14E, the velocity is commonly referred to the square root of the momentum, which is called C divided by the density. This is simplified in the below equation:
v = C / sqrt(ρ)
The common value of C is from 90 to 125 depending on the company or project standards followed.
Access 4 courses in 1 bundle
Discover with real-world examples what a process engineer needs for pipe sizing, pump hydraulics, control valve calculation and compressor operation
Minimum velocity criteria
When calculating the required pipe size, we target it to be less than the required maximum velocity. However, there are cases where a minimum velocity should be considered.
Additionally, for flare purge lines, it is a common practice for some companies to consider a minimum velocity of 1 m/s to keep the flare running and avoid air ingress, which can lead to an explosive mixture in the flare header.
In case of two-phase flow, API 14E recommends a minimum velocity of 10 ft/s to reduce the probability of slug formation, although this needs to be verified by calculations.
Pressure Drop
Now after we talked about the velocity criteria, let’s talk about the maximum pressure drop criteria.
As the flow rate of a fluid through increases, its velocity increases, this means that this shall cause more friction losses with the pipe. This would mean higher pipe resistance to flow.
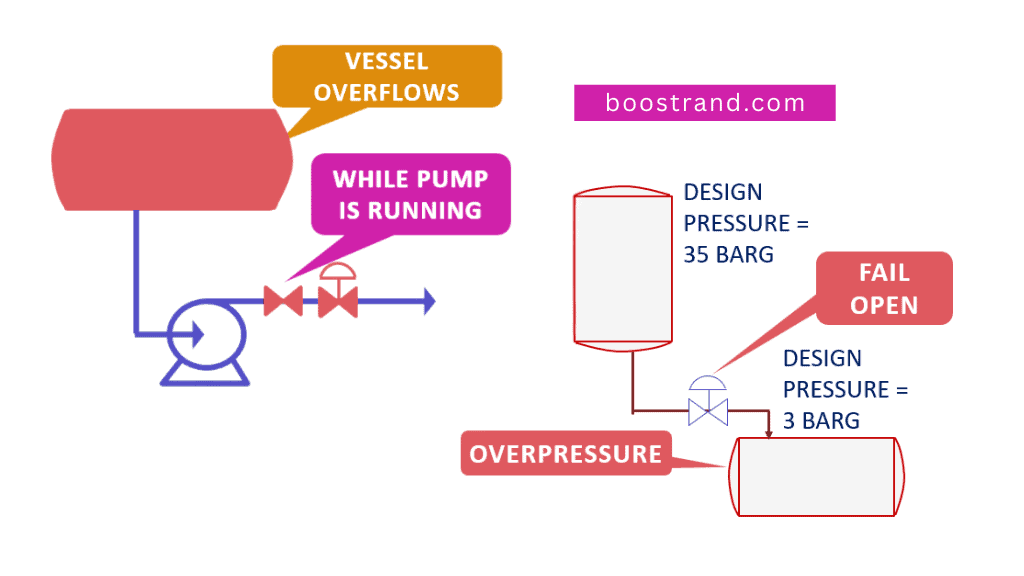
If the pipe is not large enough, this shall cause the fluid to lose much pressure. This can be a cause to reduce the flow rate to be less than the desirable flow, which can affect the whole plant operation and may even lead to plant shutdown.
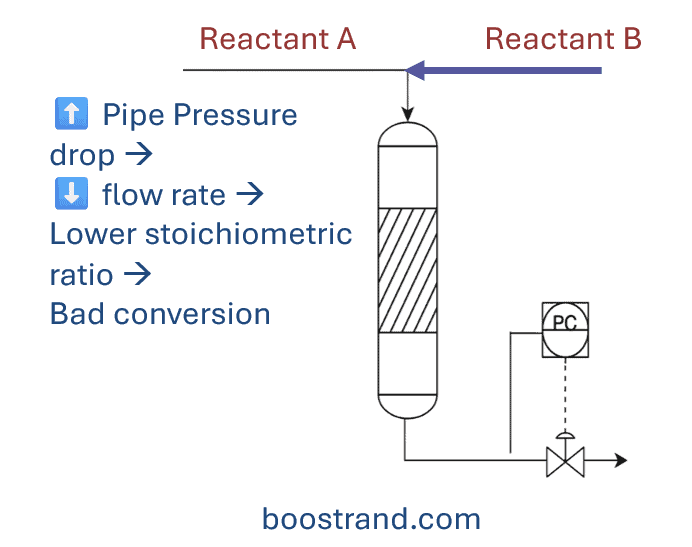
For example, if the liquid is fed to a reactor that is operating at 20 barg. Let’s assume that the required flow rate of this liquid is 50 m3/hr and is fed from a source at 21 barg through a 4″ pipe. Based on the pressure drop calculation, the pressure drop was 2 bar. In this case, the destination pressure would be 19 barg.
The case here is that the pressure in the reactor is controlled through a specific setpoint of 20 barg. This would mean that the flow rate of the liquid to the reactor would decrease to meet the 20 barg at the reactor. This reduced the flow rate to 40 m3/hr instead of 50 m3/hr. This reduction in flow disturbed the stoichiometric ratio with other reactants, leading to a disturbed conversion and an off-spec product.
By increasing the pipe size to 6″, the pressure drop was significantly reduced and the required flow could reach the reactor at 20 barg.
Rough VS Firm Approaches for calculating pressure drop
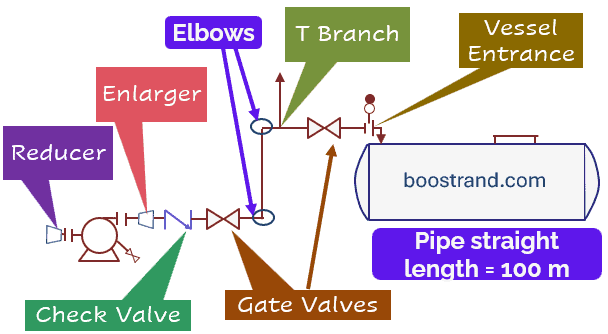
Calculating the pressure drop in a pipe is not as easy as calculating the velocity. In order to calculate the exact pressure drop in a pipe, we need to know the pipe details. These represent:
- Pipe straight length
- Number of valves and fittings such as elbows, tees, reducers, enlargers, nozzles, ..etc
- Static head (ups and downs).
In order to avail these details, we would need pipe isometrics, which are not available at the start of the project.
Rough Approach
That’s why we use a rough approach in the beginning. In this phase, we rely on the process design criteria same as we did when calculating the size based on the velocity criteria.
These criteria would consider a maximum pressure drop per length of the pipe. So based on the fluid flow rate and physical properties, this pressure drop per length shouldn’t exceed a certain value.
Same as velocity criteria, pressure drop criteria depends mainly on the project or company standards as well as the service of the pipe. For example, in the case of pump suction line, the maximum pressure drop can be 0.5 bar/km, while in the case of pump discharge line, a pressure drop up to 3 bar/km can be tolerated.
This is the common approach that is followed in the beginning when we don’t have enough data. Rough sizing can also be used in non critical lines where pressure drop won’t have a high effect on the process.
Firm Approach
Now, as we are having the pipe data in hand, and for cases where pressure drop needs additional check, we would need to carry out firm approach to ensure that the total pressure drop in the pipe won’t affect the operation. The below are some cases where firm approach is needed:
- Pump Hydraulic calculations: These can highly affect the performance of the pump. High pressure drop in suction line can cause low NPSH. For discharge line, excessive pressure drop may lead the pump to be not able to deliver the required flow. The outcome of firm sizing should be reflected in pump calculations.
- Reboiler and Condenser Hydraulics: These are very sensitive loops their pressure drop should be minimal. So we should ensure that for the reboiler loop, the piping between the tower and reboiler back to the tower shall have minimum pressure drop. Same case for the piping from the tower to condenser up to the accumulator. High pressure drop in these loops would mean less flow to reboiler and condenser, which would disturb the whole tower operation
- Inlet and outlet lines to PSV: As discussed in our article 4 Key Factors Affecting PSV Sizing & Operation, this can highly affect the PSV operation. API 520 states that maximum pressure drop in the inlet pipe shouldn’t exceed 3% of set pressure, while the outlet pipe should have a size that would guarantee a suitable backpressure depending on the PSV type.
- Flare header lines: As stated when talking about maximum velocity, maximum velocity in flare header lines can approach the sound velocity. However, it should also ensure a backpressure that won’t hinder the function of any of the PSVs or depressurization functions. This even needs a thorough analysis using software like Aspen Flare Analyzer for example.
Aspen Flare Analyzer Screenshot
Two-Phase Flow Regimes
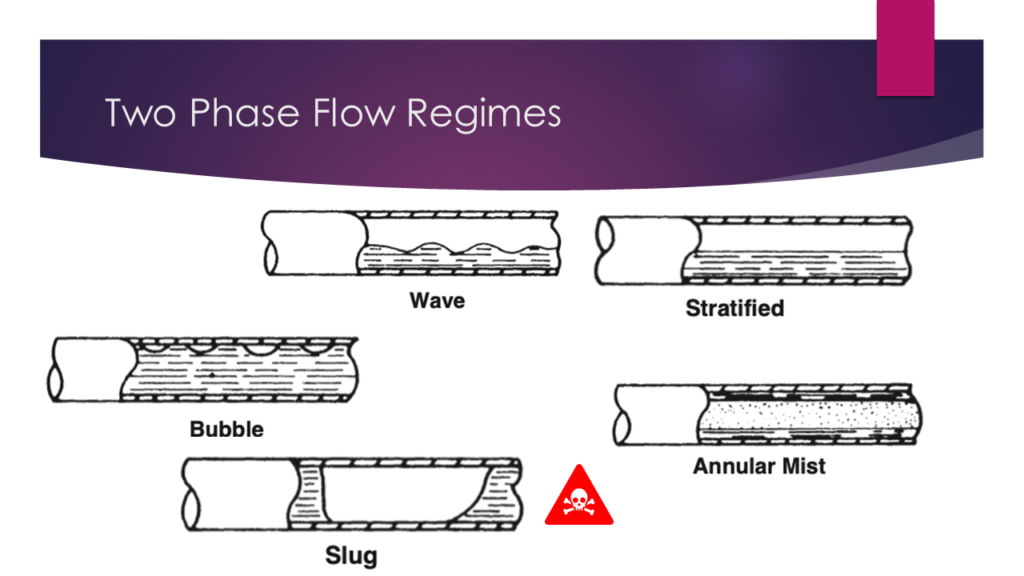
In process plants, it’s highly common to transport a mixture of liquids and vapors. This is called two-phase flow. There are various types of flow regimes for a two phase flow. It can be :
- Wave flow
- Stratified flow
- Bubble flow
- Annular mist flow
- And slug flow which is the most undesirable one.
Two-phase flow is the most critical type of fluid flow. This is because its calculation is much more complex. It’s very sensitive to changes in fluid conditions and pipe orientation. You can check out this article if you’d like to know more about twr-phase flow regimes.
The flow regime is highly affected by the following factors:
- Vapor fraction among the fluid
- Flow rate and physical properties in both liquid and vapor phases
- Pipe size
- Pipe orientation and flow direction, being horizontal or vertical to upward or downward direction
All these factors affect the velocity of liquid and the velocity of vapor in the pipe, which is the main factor that forms the fluid regime. There have been several charts and models to predict the flow regime such as Mandhane chart for horizontal piping and Aziz chart for vertical piping.
The below were example is from a two phase calculation that was carried out in my pipe sizing course included in flow course bundle where the flow regime was determined based on the fluid and pipe data.
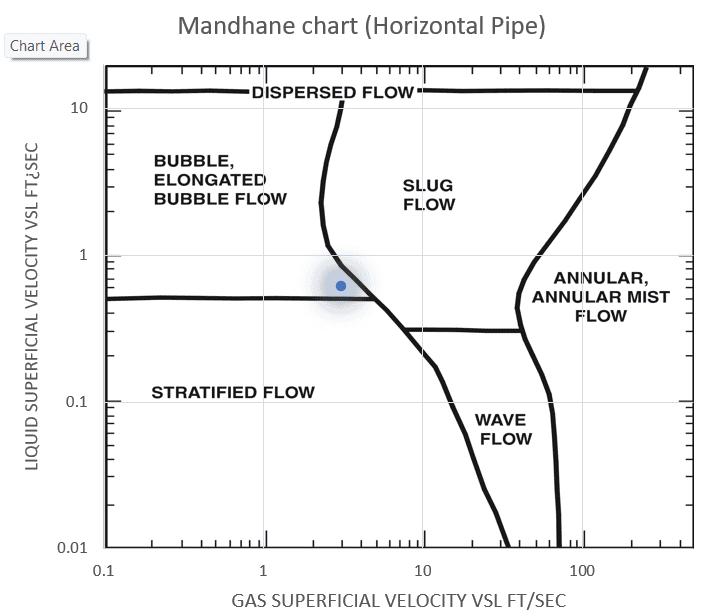
So here we see that the flow regime is bubble flow for a horizontal pipe.
Effect of Intermittent flow (Slug and Plug Flows)
Slug flow is a flow regime within pipelines where a series of liquid “slugs” are separated by large gas pockets. This phenomenon occurs at higher gas velocities, causing elongated gas bubbles to grow in size until they are comparable to the pipe’s diameter, resulting in large amplitude waves or liquid slugs. If the diameter of these gas bubbles is large but still less than the pipe diameter, this is commonly called plug flow.
Intermittent flow is undesirable for these reasons:
- It causes vibration waves in the pipe, which can lead to pipe damage if the pipe isn’t well supported.
- It leads to sudden huge liquid volumes called slugs. This can highly affect the downstream vessels receiving these large sudden volumes, which can lead to overflow of these vessels.
That’s why intermittent flow is undesirable. We should try to avoid it as much as possible when calculating the pipe size. Sometimes, reducing the size of the pipe can get us away from slug flow. However, as a process engineer is commonly dealing with different operating scenarios and turndown capacities, it may be sometimes difficult to avoid slug flow.
In the same example I carried out the flow regime estimation for the same fluid. However this estimation is now for the vertical pipe. After applying Aziz chart, we can see that slug flow cannot be avoided for vertical pipe regardless the pipe size was increased or decreased.
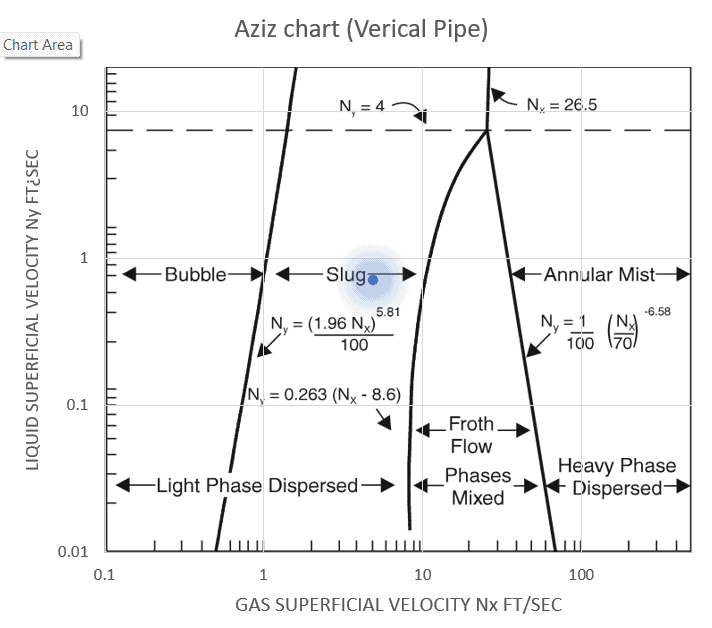
To avoid slug flow, we could either significantly increase the pipe size, which may not be optimal from cost and engineering perspectives, or greatly reduce the pipe size, which would lead to excessive velocity and pressure drops, thereby disturbing the operation.
Here we should ensure that the pipe is well-supported and the downstream facilities can handle these liquid slugs. This may need dynamic simulation to calculate maximum liquid volumes and slug velocities.
Effect of Process Design Criteria
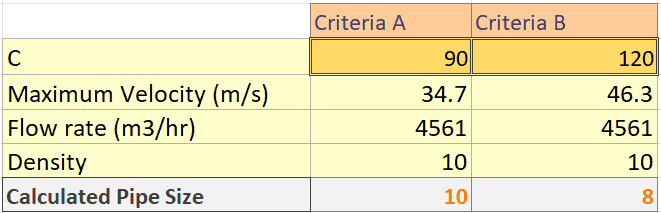
We have seen in the above section how the sizing criteria differs depending on the service. In addition to the service, most companies consider their criteria for pipe sizing, dictating maximum velocity and pressure drop for each service. This is an example of pipe sizing criteria that is used to calculate the pipe size. Criteria differ between companies, which can yield to different pipe sizes for the same service.
For example, in case of velocity in gas lines, API 14E states that C ranges within 90 to 125. I have seen some companies taking it to be 90, others consider it to be 100, others may consider it as 125. If we considered C as 90, this would yield the larger size.
Same thing for pressure drop rough sizing, some companies may take it as 3 bar/km, others may take it as 2 bar/km, which shall lead to the larger size.
So here, when starting a project, it’s highly important to define the criteria that shall be used. Sometimes we may find the criteria to be very stringent leading to a very large size. In this case, permission should be taken to waive this criterion. Otherwise, failing to comply to the design criteria can lead to issues with other stakeholders and can lead to cost impact if this was in a late stage and pipe material was already purchased.
How Pipe Sizing Calculation Works
Standard Pipe Sizes
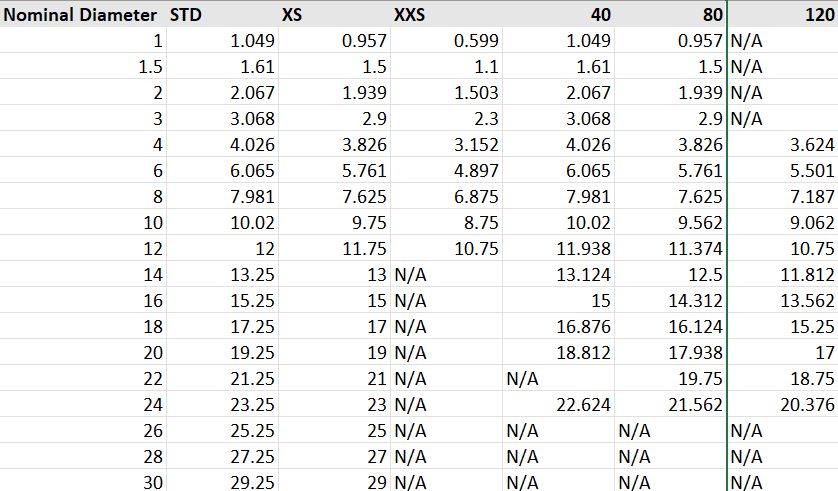
As piping is considered among bulk material which isn’t governed by special fabrications, the industry has considered standard pipe sizes as this guarantees easy supply, delivery and much lower cost. The below table shows the standard pipe sizes used.
Here we should pay attention to the below designations:
- Nominal Diameter: This is the standard diameter of the pipe. For example, when we say a 6 inch or 10-inch pipe, we mean the nominal diameter. It’s commonly less than the outside diameter, and in most cases larger than the inside diameter except for small sizes with low pipe schedules where they can be smaller than the inner diameter.
- Pipe Schedule: This is a designation of the pipe thickness. For example, STD schedule yields a lower thickness than schedule 80 or 120. A larger thickness for the same nominal diameter means a smaller inside diameter. The pipe schedule mainly depends on the material of construction, corrosion allowance, and design pressure. You can check it with the piping engineer.
- Internal Diameter: The inner diameter, which is the diameter where the fluid flows. All velocity, pressure drop, and two-phase calculations should be based on the pipe inside diameter.
Sizing Procedure
So in order to calculate the required pipe size, we can follow the below steps:
- Determine a preliminary inner diameter based on maximum velocity. Let’s say that based on a maximum velocity of 3 m/s, the pipe inner diameter was 6.5 inches
- Approximate the inner diameter to the higher nominal size (in this case it shall be 8″). Based on the pipe schedule, get the inner diameter. Let’s say that based on STD schedule, the pipe inner diameter will be 7.98 inches.
- Calculate the pressure drop per length (rough sizing approach) based on the new inner diameter.
- If the criteria is not met, then increase the size to the next nominal diameter which is 10″. Get the inner diameter based on the pipe schedule and recheck until the rough sizing criteria is met.
- In case the line size was getting too large or the hydraulic calculation is critical, conduct firm approach analysis to check the exact pressure drop and assess the current pipe size.
Tools to calculate pipe size
To calculate the pipe size, you can use the equations used to calculate velocity and pressure drop. For two-phase flow, more complex equations are used.
You can also use some online tools such as Checalc or a mobile app such as Process Engineer toolbox available on IOS.
Process Engineering Masterclass
Become a Professional Process Engineer, discover process engineering career, role, activities and common practices with access to most of the courses here.
Effect of Line Sizing on Project Workflow
Now, as a process engineer calculated the pipe size, he is responsible to state it on the P&ID. It’s highly important to ensure that the pipe sizing is well reflected on the P&ID as a piping engineer doesn’t have access to the pipe sizing calculation. Otherwise, sizing not reflecting properly can lead to purchasing wrong material, which can cause more cost, delay in the project and operational issues.
Conclusion
In conclusion, this article has highlighted how critical pipe sizing is within process design, affecting not just the operational efficiency and safety of a plant, but also its cost-effectiveness. By adhering to established criteria and standards, and adjusting these based on specific project needs and services, engineers can ensure that pipelines are optimally sized to support smooth and safe plant operations.
As demonstrated, pipe sizing is not merely about adhering to technical specifications; it also plays a pivotal role in the overall project workflow, influencing everything from procurement to installation. Proper communication and documentation, such as accurately reflecting pipe sizes on P&IDs, are essential to avoid costly errors and project delays.
Start your Career
Access Process Engineering Introduction Course
Share this:
[…] creation of a PFD is typically based on the output of process simulation software. We have discussed plant simulation’s role in a project in the previous article. In a nutshell, process simulation involves using specialized software to model and analyze the […]