So we started our project, we carried out our plant simulation activities, and we modeled different cases using simulation software. Now, it’s time to wrap up all that we have modeled. This is an essential step in order to move forward in the project. Here comes the role of a Process Flow Diagram (PFD).
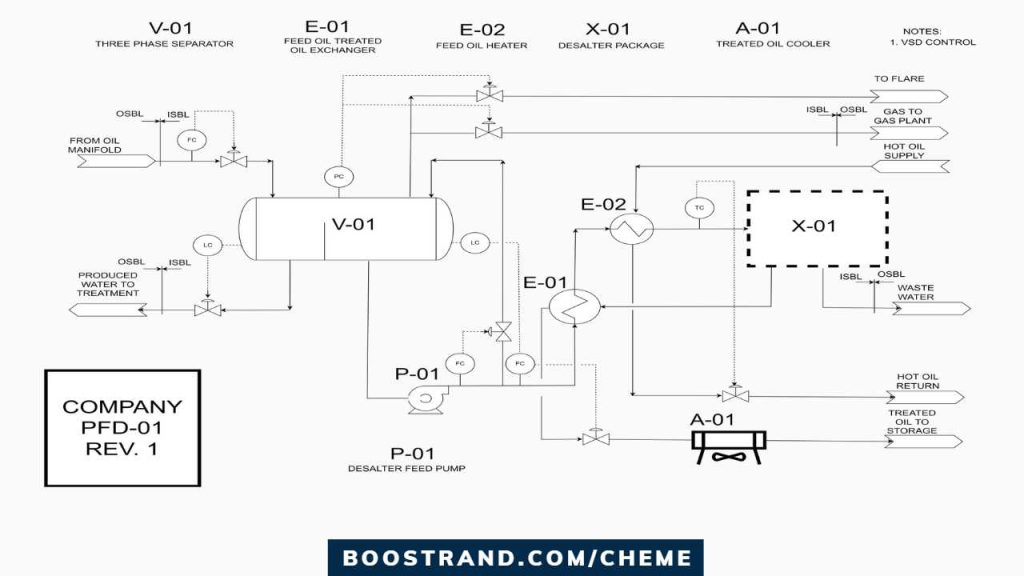
A Process Flow Diagram is a schematic representation of a process, illustrating the main plant data and serving as the foundation for developing Piping and Instrumentation Diagrams (P&IDs). It plays a vital role in the overall process design, providing engineers with a visual representation of the process and aiding in identifying and analyzing various process parameters.
In the world of engineering and industrial processes, the creation of a Process Flow Diagram (PFD) is a crucial step in designing and understanding the system. Based on a PFD, project workflow is transferred to a more critical stage. This is because it is considered the official document summarizing all the results we had from plant simulation, so we can now unlock our downstream process activities.
In this article, we will delve into the significance of PFDs, their relationship with process simulation, the data they encapsulate, and their role in creating P&IDs.
You can watch the content of this article in the below video, or you can skip the video and continue reading:
PFD as a Key Document
A Process Flow Diagram serves as a key document that provides a high-level overview of a process. It showcases the main plant data, including the major equipment and process streams, allowing engineers to understand the overall process configuration.
As we have explained before, PFDs are essential during the conceptual and preliminary design stages. This is because they help define the project’s scope and determine the equipment required for the process.
Moreover, PFDs serve as the foundation for developing detailed Piping and Instrumentation Diagrams (P&IDs), which contain more specific information about the process. Based on P&IDs, non process disciplines can start their work.
PFD is Based on Process Simulation Output
The creation of a PFD is typically based on the output of process simulation software. We have discussed plant simulation’s role in a project in the previous article. In a nutshell, process simulation involves using specialized software to model and analyze the behavior of a process under various operating conditions. It takes into account factors such as fluid properties, heat transfer, mass balance, and reaction kinetics to simulate the process behavior accurately.
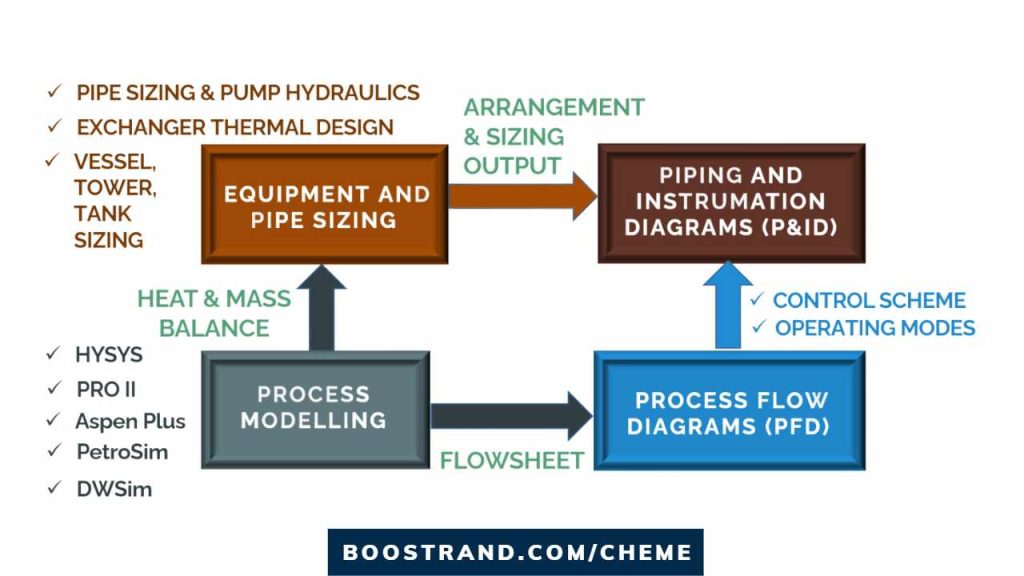
The simulation software provides valuable data used to construct the PFD. So based on the simulation output, we can get a simplified process flowsheet showing all necessary equipment, and we can get the heat and mass balance output table. In most projects, we have multiple process simulations based on different operating cases. So we want to show this output in one document.
So here, the simulation output shall be reflected in the PFD so that it can serve downstream activities.
Data shown on PFD
So what are we expecting the PFD to show? Let’s see:
Equipment Representation
A Process Flow Diagram provides a comprehensive view of the major equipment units involved in a process. For instance, in a chemical manufacturing plant, the PFD may include reactors, distillation columns, pumps, heat exchangers, and separators. Each equipment unit is represented by a unique symbol on the PFD, accompanied by relevant information such as size, capacity, and operating conditions.
So, for example, if we are dealing with a tower, a PFD typically shows the operating pressure and temperature of the top and bottom sections. For heat transfer equipment, we show the inlet and outlet temperatures. For a pump, we sometimes show the pump volumetric flow rate.
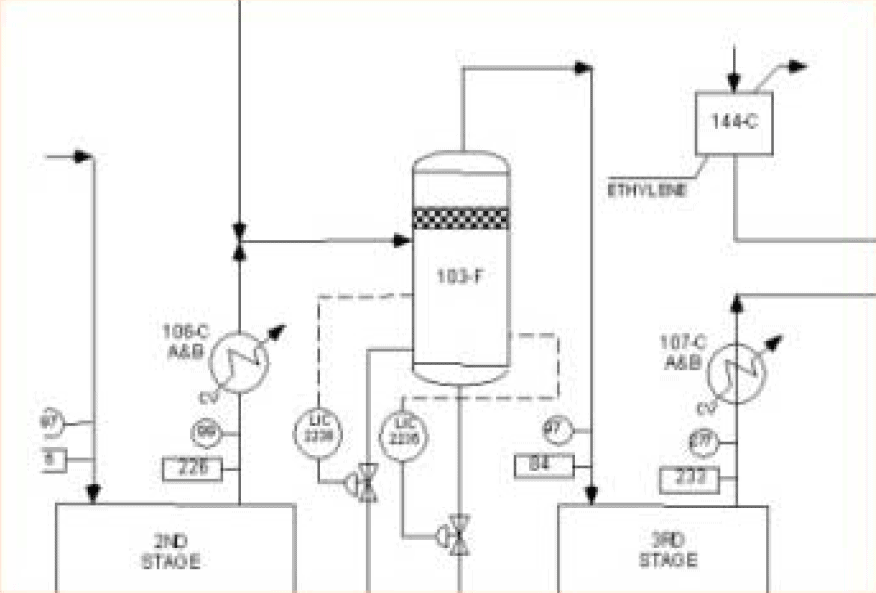
This visual representation allows engineers to analyze the overall process configuration and make informed decisions regarding equipment selection, placement, and sizing. By showing the overall process scheme, we can start evaluating the expected operating scenarios and process upsets that shall occur. This shall be further analyzed when developing the P&IDs.
Process Stream Analysis
Process streams are the lifeblood of any industrial process, carrying materials, energy, or information throughout the system. A well-constructed PFD provides detailed information about the main process streams, including their names, compositions, flow rates, and temperatures. Although a PFD may show the main process conditions of important streams, the stream data are usually accompanied by heat and mass balance tables attached to the PFD.
Let’s consider an oil refinery as an example. The PFD would display the various streams involved, such as crude oil, intermediate products, and finished products. By analyzing flow rates and physical properties of these streams, we can identify bottlenecks and ensure proper downstream equipment and pipe sizing activities.
Elevate your Process Engineering skills
Access our courses today!
Process Control
A Process Flow Diagram (PFD) goes beyond a flowsheet output from simulation software by incorporating control loops.
So, for example, a PFD shows the process parameters that we shall control, such as pressure, temperature, level, and flow rates. In addition, it shows the behavior of the control loop, whether it shall be feedforward or feedback, or cascade, or if there is a low signal selector, a custom function such as summation of 2 flow sources or ration control,..etc. If you like to know more about the factors that affect choosing the control scheme, you can check out this article.
By choosing the optimum control parameter, the PFD assists in establishing effective control strategies to ensure that the process operates within specified operating limits.
In addition, a PFD also shows manual control. This is not the common case. But if, for some reason, there is a specific parameter that is controlled manually by the operator, then the PFD shall show the manual valve and the instrument from where the operator shall see the reading.
Reflecting the control schemes on a PFD gives engineers and operators a holistic understanding of the process dynamics. In addition, this optimizes control strategies for efficient and safe operation.
Modes of Operation
By including utility information in the PFD, engineers can assess energy requirements, identify opportunities for heat integration, and optimize utility consumption to minimize energy costs and environmental impact.
Understanding the modes of operation is essential for optimizing process performance and ensuring safe and reliable operation. The PFD captures this information, indicating whether the process operates continuously or intermittently.
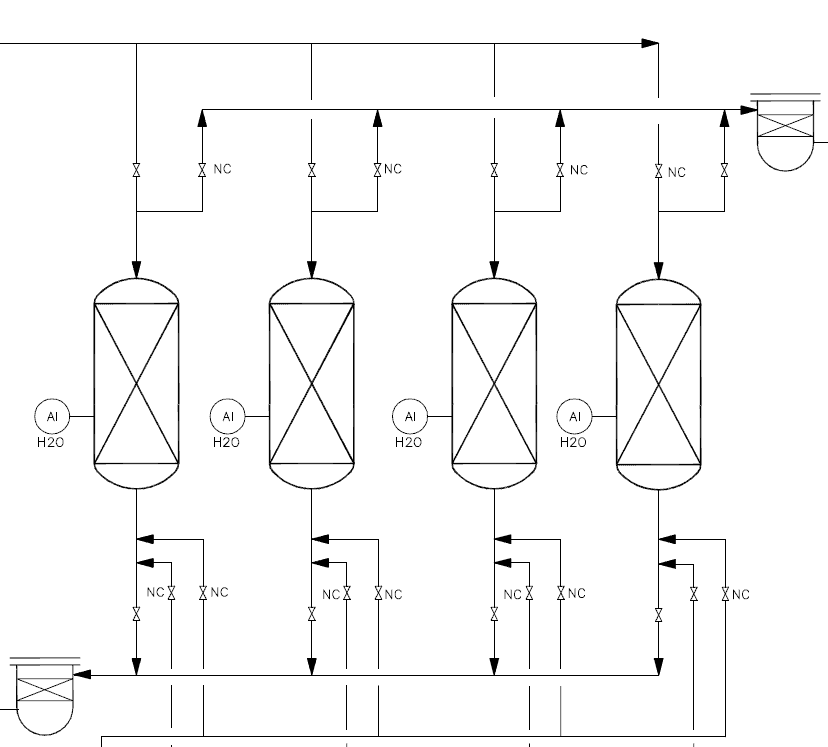
Let’s consider an example of pressure swing adsorption process, this is a semi-batch process. So sometimes we are having a bed in adsorption modes. The bed is then saturated. So the inlet and outlet valves positions are switched in order to start bed regeneration. For the other bed, it’s now regenerated, so the position of its inlet and outlet valves are also switched to start adsorption mode.
So here, although the PFD doesn’t show manual or on-off valves, both beds’ inlet and outlet valves are commonly shown with the required positions. This is because they are part of the operation.
The PFD would outline the different stages of the batch process, including charging, reaction, separation, and product storage. This information helps engineers design appropriate control systems, establish operating procedures, and optimize cycle times for efficient batch production.
Utilities and Energy Management
Utilities play a critical role in energy management and overall process efficiency. That’s why a process engineer should clearly understand the utilities used. For instance, when considering a water cooler in a PFD, it should consider the maximum inlet temperature of cooling water. So if the plant has cooling water available at 25 C, we can’t use cooling water to cool a fluid down to a temperature less than this temperature. On the contrary, we should consider a reasonable temperature approach for the outlet fluid temperature.
If we are using steam for heating or stripping operations, then the PFD should consider the operating pressure of the available steam and whether it is saturated or superheated.
So a PFD should be in harmony with the available plant resources. If the available utilities cannot fulfill the PFD requirements, we may need to look for other solutions. Otherwise, we may find ourselves adding new utilities, increasing the overall project cost.
PFD is the Base for P&ID Development
Let's go into P&IDs
P&ID journey: familiarize with P&ID details, anatomy, workflow, discover operation, maintenance & safety best practices
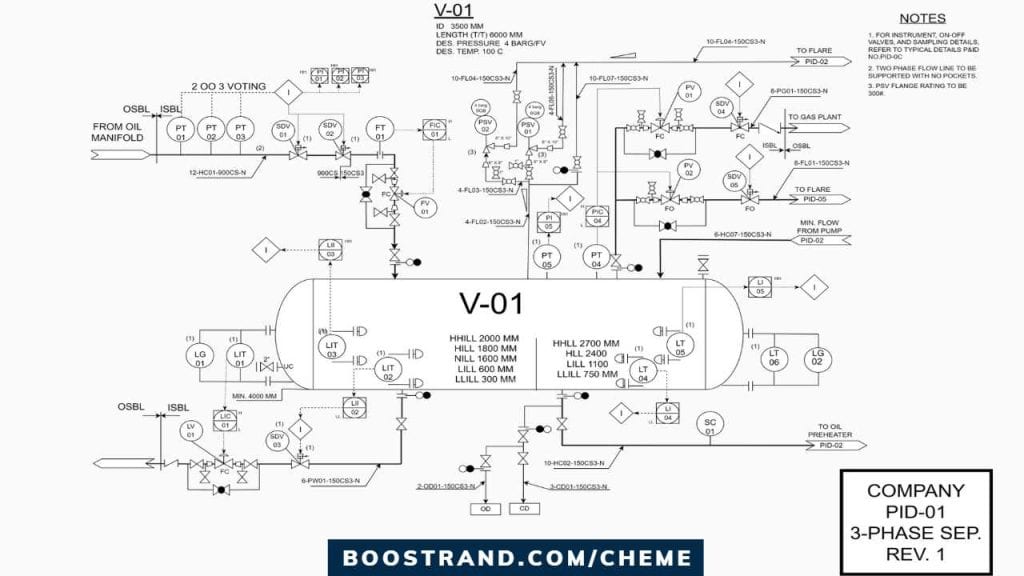
The Process Flow Diagram serves as the foundation for creating detailed Piping and Instrumentation Diagrams (P&IDs). P&IDs provide a more comprehensive representation of the process, illustrating the specific piping arrangements, instrumentations, control systems, and safety measures.
For example, a PFD for a wastewater treatment plant would show the general flow path and major treatment units. Based on this PFD, engineers can develop P&IDs that outline the precise piping connections, instrumentation locations, and control loops for each treatment unit. The PFD acts as a reference, ensuring that the P&IDs accurately reflect the overall process configuration and facilitate the smooth operation and maintenance of the plant.
Conclusion
Process Flow Diagrams (PFDs) play a pivotal role in process design activities. They provide a visual representation of the process, encompassing information about equipment, process streams, utilities, and modes of operation.
By analyzing the PFD, engineers can understand the plant’s operation modes, carry out sizing activities, make informed decisions regarding equipment selection, manage utilities effectively, and develop detailed Piping and Instrumentation Diagrams (P&IDs). The accurate representation of the process through PFD promotes efficient communication, process optimization, and safe operation in various industries.
Start your Career
Access Process Engineering Introduction Course
Share this:
[…] creation of a PFD is typically based on the output of process simulation software. We have discussed plant simulation’s role in a project in the previous article. In a nutshell, process simulation involves using specialized software to model and analyze the […]
